
Let's Get Started!


In this eLearning module, you will need to master six objectives to graph a parabola successfully. At the bottom of this page, you will see a button that takes you to the next objective. It is essential to take the assessments on each page to see if you understand the material of that objective.
The first objective will be to put an equation in standard form, followed by evaluating the y-intercept, evaluating the x-intercept, evaluating the vertex, calculating a table of values, and then finally graphing the parabola. The header also has each site at the top. Feel free to go back and recall past objectives if you are having problems.
Let's first discuss what a parabola is:
There are several definitions to parabolas, but I feel that we should go with the least complex version of the definition.
Definition of a parabola: A U-shaped line that is symmetrical to its vertex
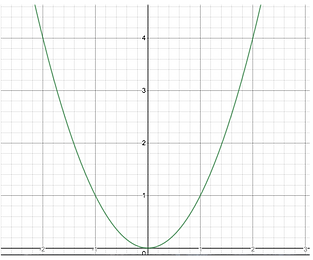
The picture above is the graph y=x^2
A parabola is formed from a quadratic equation
Quadratic Equation: Is an equation where the highest exponent with a variable is 2.
Real-World Application

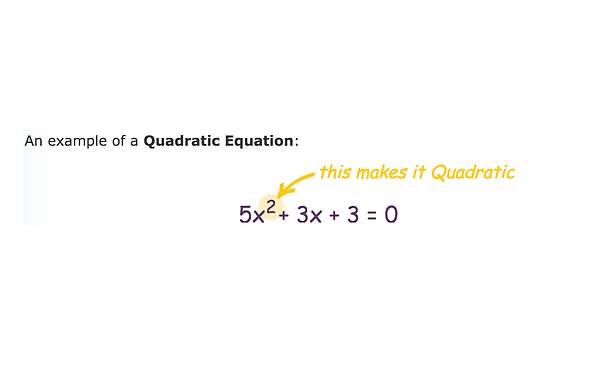
* Quadratic Equations must have a squared value to them.
There are many useful real-world applications for learning about parabolas. Parabolas help us with modeling projectiles (kicking a ball, shooting an arrow, or rocket takeoffs), constructing bridges, and satellites.


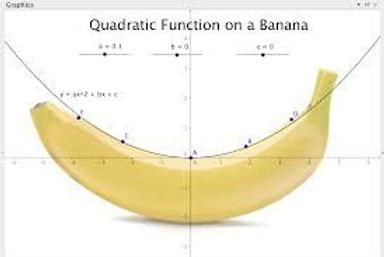
There are multiple uses to parabolas!
Comment on the discussion blog to give your thoughts about parabolas.
After you are done blogging, feel free to head to the next section!