top of page
Table of Values
00:00 / 00:18
Once you solved your y-intercept, x-intercept(s), and vertex you will need to create a table of values.
As we stated before, a parabola is reflective about the vertex (the points are the same distance on both sides).
Let's look at an example:
Let's say we are given the equation.
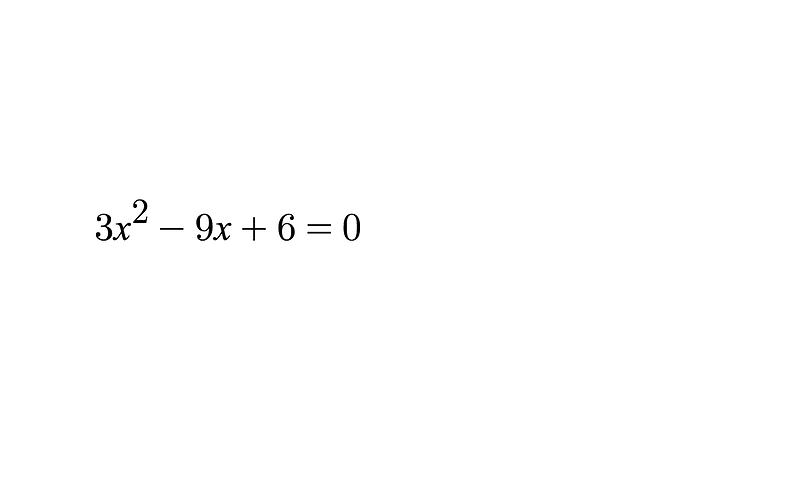
Based on the previous pages we need to identify and evaluate the y-intercept, x-intercept(s) and the vertex.
00:00 / 00:17
y-intercept
Since our equation is in standard form our y-intercept will be the c value.
This means that 6 is our y-intercept.
00:00 / 00:17
x-intercept(s)
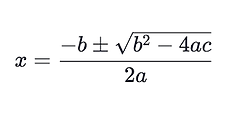
We need to use the quadratic formula on the standard equation.

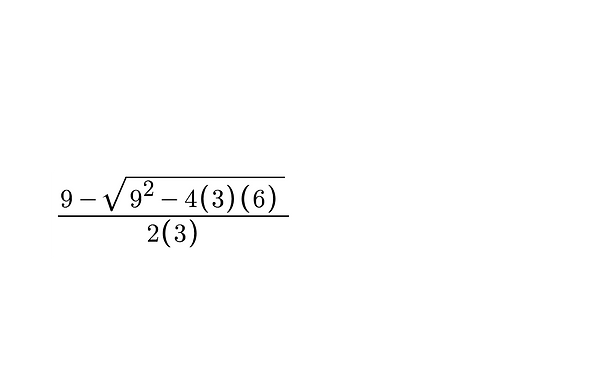
x = 1
x=2
Vertex
We need to identify if our vertex is a max or min value. Since our "a" value is positive we have a min.
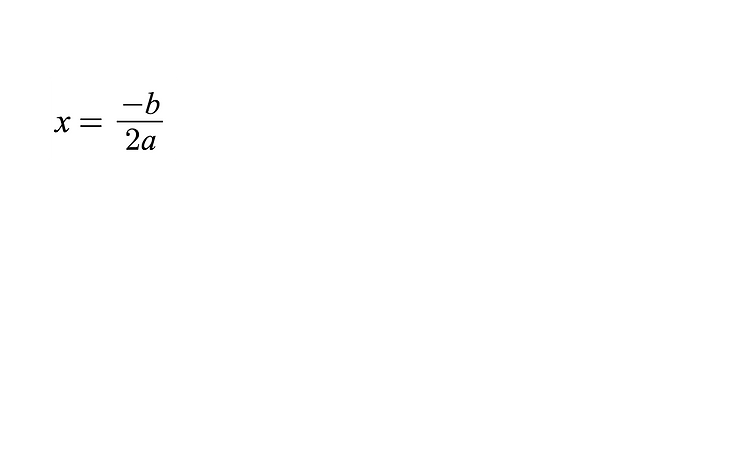
We need to use our vertex formula:
x = 1.5

Substitute x
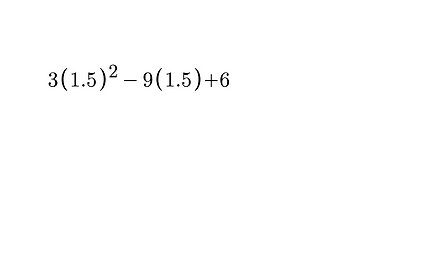
y = -7.5
Vertex formula
Substitute values
Simplify
Simplify
Now that we have our y-intercept, x-intercepts, and vertex we can plug them into our table.
00:00 / 00:45
00:00 / 00:57
00:00 / 00:27
X-Values
Y-Values
1
1.5
2
0
-7.5
0
0
6
Missing Value
Missing Value
Table of Values
00:00 / 00:33
Notice the missing value in the table above
We need to fill in the missing information.
Since we solved for the vertex and our intercepts, it gave us a frame of reference for our table.
The rule of thumb when deciding what values to take for your table is a value less then and greater then your x-intercepts.
This allows you to plot values on your coordinate grid to make your parabola more accurate.
Let's take the value
x=3
into our table.
00:00 / 00:21
Let's plug in 3 in for x to see how our table looks
x = 3

y = 6
00:00 / 00:09
Now we can plot the points from the table. When we do this, we can create an accurate parabola for our graph.
00:00 / 00:06
The video below will help you on how to create a table of values:
00:00 / 00:18
Let's try an activity!
Below are two button to two different activities. One button will take you to a Desmos site, where you will need to fill in different table values. The other is a different Wix site asking you various questions about table of values.
*Once you finish the Desmos activity close out of the Desmos window
Class Code:
K8HZVF
00:00 / 00:06
Try the assessment button to see what you know about Table of Values.
00:00 / 00:15
If you did well on the assessment click the button to the right to go to the next objective.


bottom of page